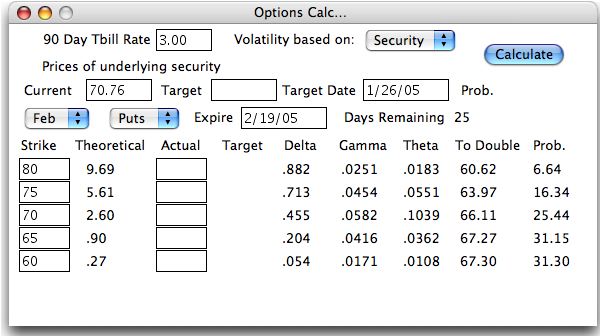
Powerful, Innovative Features include:
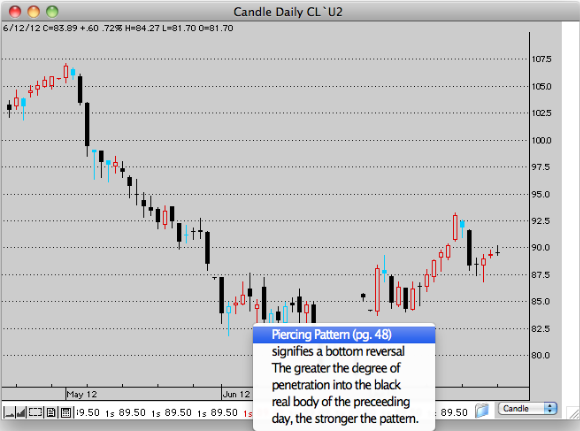
- Candle Pattern Analysis... Yes, Personal Analyst will identify significant candle patterns on chart with pop-up explanations providing invaluable instruction to the novice and confirmation to the expert.
- Technical Screening...
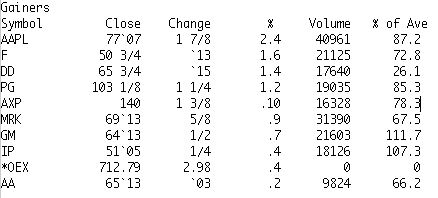
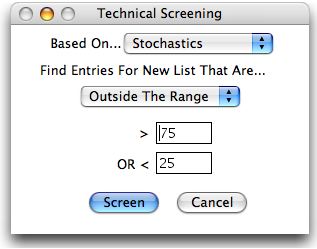 imagine your software searching your list for securities with volume greater than average volume, that are within 90% of their 12 month highs and whose RSI value is less than 30. Now imagine that you have this capability with dozens of rankings and virtually unlimited control of the criteria used and the order of preference. Stop imagining, it's all here and it is as easy to set-up and use as font controls in a word processor. imagine your software searching your list for securities with volume greater than average volume, that are within 90% of their 12 month highs and whose RSI value is less than 30. Now imagine that you have this capability with dozens of rankings and virtually unlimited control of the criteria used and the order of preference. Stop imagining, it's all here and it is as easy to set-up and use as font controls in a word processor.
- Computer Generated Ratings... apply multiple technical studies to your list of securities en masse, producing numerical ratings that can be used to find trading opportunities.
- Classic Charting... From Point and Figure to Semilog scaling,
Japanese Candlestick to traditional bar, Analyst does it all with the
speed, precision and flexibility you need.
- Innovative Features... like EquiView, Compare and
General Market charts found only in our products. EquiView displays
two years of prices on the same security on the same chart. Perfect
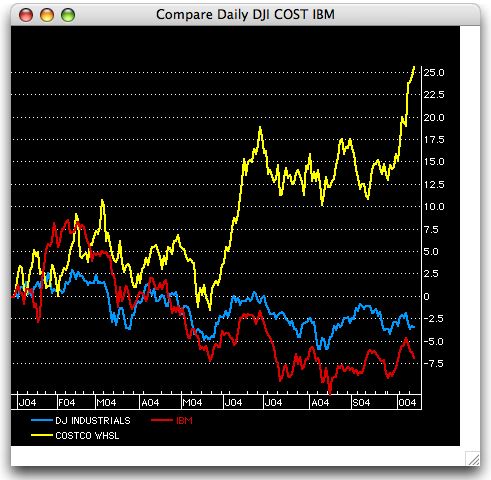
for viewing seasonal tendencies. Compare displays 1 to 4 separate securities
on the same chart for comparison. Our General Market charts display
an advance-decline line, up volume versus down volume, the TRIN, McClellan
Oscillator and McClellan Summation Index. And analytics developed by
Trendsetter like our True Range Oscillator, CycleFinder, Trendsetter
Momentum Index and Computer Generated Trendlines give you the edge over
other traders and investors.
|
 imagine your software searching your list for securities with volume greater than average volume, that are within 90% of their 12 month highs and whose RSI value is less than 30. Now imagine that you have this capability with dozens of rankings and virtually unlimited control of the criteria used and the order of preference. Stop imagining, it's all here and it is as easy to set-up and use as font controls in a word processor.
