Leonardo Fibonacci was an Italian mathematician who lived in the thirteenth century. His work on the relationship of mathematics and nature has been applied in physics, astronomy and engineering. In nature we see uncanny instances where the fibonacci sequence occurs. For example, the number of leaves on flowers is consistently a fibonacci number and the number of spirals in sea shells, vegetables, seed heads and galaxies follow this sequence and it's ratios. Many market analysts believe that Fibonacci principles apply equally as well to markets and market psychology.
The Fibonacci number sequence is created by adding the last two numbers in the sequence to create the next number (i.e., 1, 1, 2, 3, 5, 8, 13, 21, 34, 55, 89, 144...). The first three numbers in the sequence are normally dropped for analysis purposes. The number sequence creates some interesting mathematical relationships. The most commonly used are: the ratio of any number to its next higher number which approaches a constant value of .618 (e.g. 34/55 = .618, 55/89 = .618) also known as the golden ratio; the ratios of alternate numbers which approach a constant .382 (e.g. 21/55 = 382, 34/89 = .382). For those that are mathematically inclined, .382 is also the inverse of .618 (i.e., 1 - .618 = .382) and the square root of .382 equals .618.. An additional fibonacci ratio that has become common in analysis is the ratio of numbers that are three positions apart which is .236 (i.e. 34/144) Though not a fibonacci ratio, analysts commonly add 50% or .5 to the fibonacci ratios. Finally, people have added one additional ratio attempting to come up with a number between .618 and 1. Here there is dispute on which ration to use. .764 is the inverse of .236 ( 1 - .236 = .764) and .786 which is the square root of .618.
The latest addition to this trading tool is to use numbers greater than one to identify projected resistance and support when a market breaks out to new highs or down to new lows. The numbers are known as fibonacci extensions. The most commonly used are 1.618 which is the ratio of the main fibonacci ratios (.618 / .382 = 1.618), 1.272 which is the square root of 1.618
The number series and its ratios are used to create four indicators; ratios or retracements, time lines, arcs and fan lines.
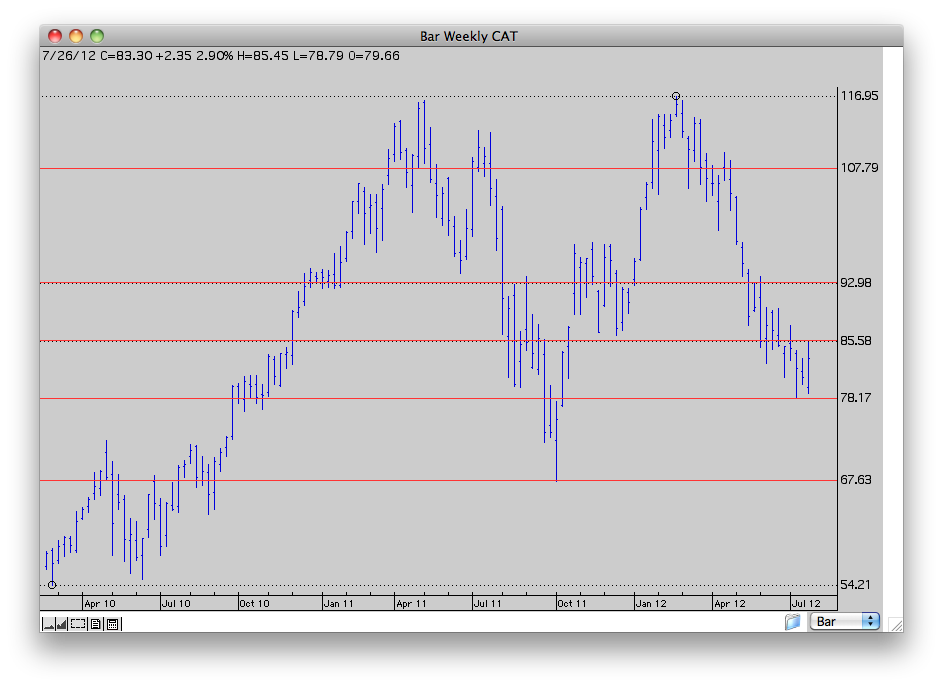
Fibonacci ratios
Fibonacci Ratios are horizontal lines drawn using the ratios .786, .618, .5, .382 and .236, from the same high or low point. It is not uncommon for markets to, after a run up, to pause and go back down before they continue to rise. One common uses for ratios is to help identify where the market might find support before it takes off for the next run. The ratios work the same way when you missed the opportunity to sell or sell short.
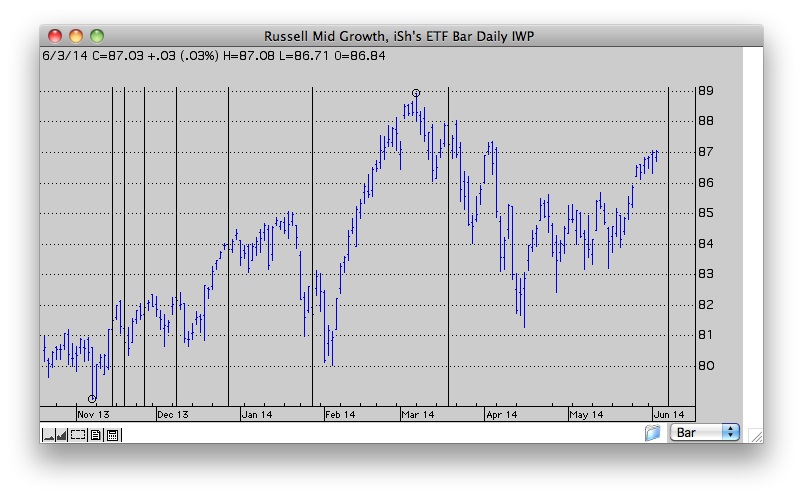
Fibonacci Time Lines
Time lines are vertical lines drawn at fibonacci intervals from the significant high or low of the current trend. The first line is drawn five days after the significant high or low which is circled. In theory, future turning points are likely to coincide near these time lines.
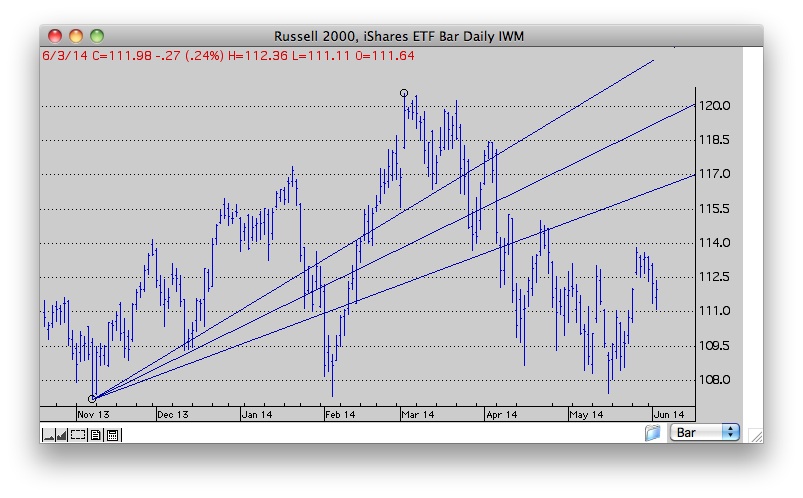
Fibonacci Fan Lines
Fibonacci Fan lines are drawn using the same high or low point. An invisible vertical line is drawn through the second extreme value. This vertical line is then divided into three using the fibonacci ratios. Three trend lines are then drawn connecting the first significant point and each of the dividing points on the invisible lineFibonacci Fan lines are drawn to identify potential support or reversal areas. Once a pullback starts, the fan lines provide analysts with key levels to watch as prices correct. After a decline, these same lines identify potential resistance or reversal areas. As with regular trend lines, support or resistance zones extend as the Fibonacci Fan lines extend making these lines dynamic.
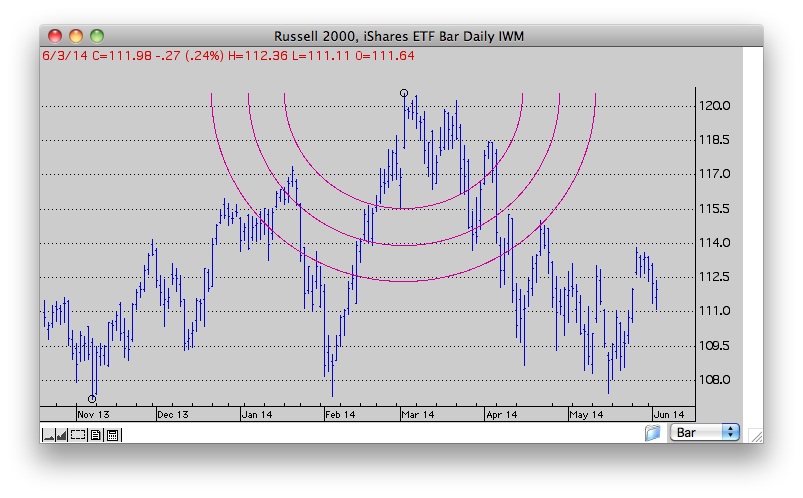
Fibonacci Arcs
Fibonacci Arcs - The radius for the first Fibonacci Arc measures 38.2% of the Base Line. The radius for the second Fibonacci Arc is in the middle of the Base Line (50%). The radius for the third Fibonacci Arc measures 61.8% of the Base Line. Three half circles are drawn based on these radii. Fibonacci Arcs add a time element to Fibonacci retracements which are only concerned with the change in price. In contrast, arcs extends from trough to peak at an angle that is dependent on elapsed time.
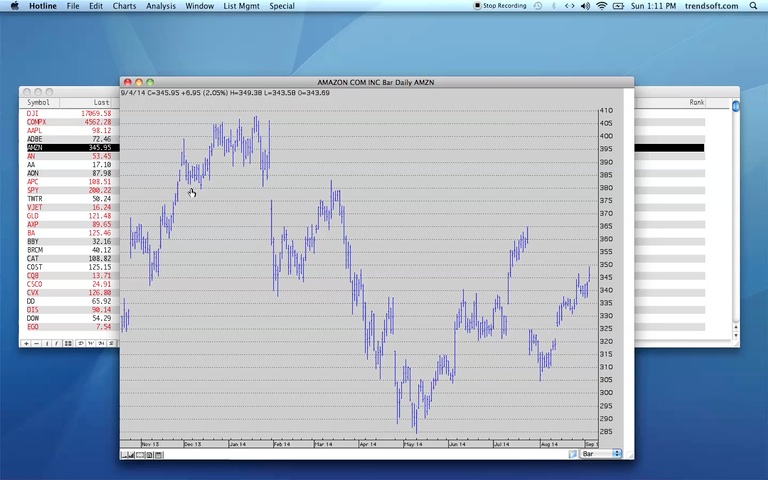
All of the charts displayed on this page were created using Personal Analyst from Trendsetter Software. For delineation, each chart contains one fibonacci indicator however, in practice, it would not be uncommon to apply multiple indicators on the same chart.
Watch this demonstration video