Japanese Candle Pattern Identification
As reported by Steve Nison
Over 100 years before traditional bar charts were developed, the Japanese were using Candlestick charts to analyze the rice market. Steve Nison, author and renowned technician, is the foremost Western expert in candlestick chart analysis. In Steve Nison's words... “A significant advantage to candlestick charting techniques is that these techniques can be used in addition to, not instead of, other technical tools. I am not trying to convince veteran technicians that this system is superior to whatever else they may be using. This is not my claim. My claim is that candlestick charting techniques provide an extra dimension of analysis.” 1
Candlestick construction is relatively straightforward. The thick part of the candlestick is called the body. It illustrates the difference between the open and closing price. Its color and structure (in this case, open red for up and solid black for down) shows whether the market closed up or down during the period (e.g., minute, day, week). The wicks or shadows coming from the bottom and/or top of the body identify the low and high price for the period. Because the body of the candle is thicker than the shadows, candle charts visually stress how the closing price relates to the opening price far more than bar charts.
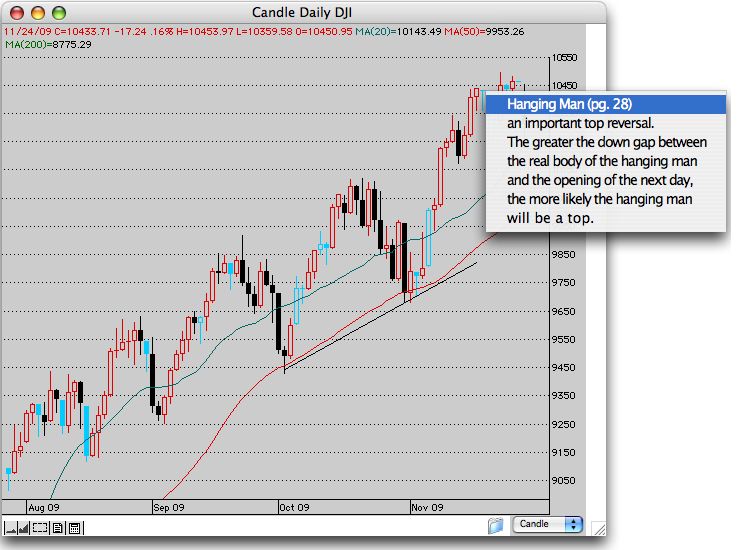
The Japanese look for patterns that are formed by the last two or three candles which indicate continuation or reversal of recent trends. The patterns have names based on translations of their Japanese names. One of our advanced features is identifying these patterns for you. Turn this feature on and candles that identify patterns are "painted" in offsetting colors (cyan in our example). Hold the mouse down on any of these candles to read a description of the pattern and its meaning. Page numbers are a reference to Steve Nison's book on candlestick interpretation. Our products identify 26 key candle patterns and HotlineX alerts you live as patterns form!
| Bullish Engulfing |
Bearish Engulfing |
| Morning Star |
Dark Cloud Cover |
| Dark Cloud Cover |
Inverted Hammer |
| Shooting Star |
Evening Star |
| Morning Doji Star |
Evening Doji Star |
| Inverted Hammer |
Shooting Star |
| Harami |
Harami Cross |
| Bullish CounterAttack |
Bearish CounterAttack |
| Bullish Beltholds |
Bearish Beltholds |
| Tri Star Tops | Tri Star Bottoms |
| Dojis |
Special Dojis |
|
All Content © 2017 Trendsetter Software, Inc.
|
Steve Nison. Japanese Candlestick Charting Techniques (p. 4) 1991