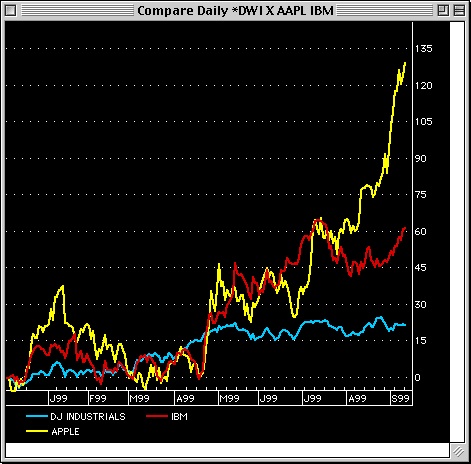
Comparison chart of Costco, IBM and the DJ Industrials.
Chart created using Personal Hotline from Trendsetter Software.
In comparison charting, each data set is plotted based on percentage change over the time period of the chart. This allows a true view of how one stock, commodity or index compares to another. In our chart below it is clear that Costco has out performed both IBM and the market as measured by the DJ.
Comparison chart of Costco, IBM and the DJ Industrials.
Chart created using Personal Hotline from Trendsetter Software.
Technical Analysis Table of Contents
Back to Trendsetter Software Products and Services ©2014 Trendsetter Software