StochRSI
Stochastics and RSI are both momentum indicators which both you stock or commodity prices to calculate their respective values. StochRSI applies the Stochastics formula using RSI values instead of price values. The indicator is measuring where the RSI's current value is relative to its high/low range for the specified period. In their 1994 book, The New Technical Trader, Chande and Kroll explain that RSI can oscillate between 80 and 20 for extended periods without reaching extreme levels. Traders looking to enter a stock trade based on an overbought or oversold reading in RSI might find themselves continuously on the sidelines. Chande and Kroll developed StochRSI to increase sensitivity and generate more overbought/oversold signals than the standard RSI does on its own.
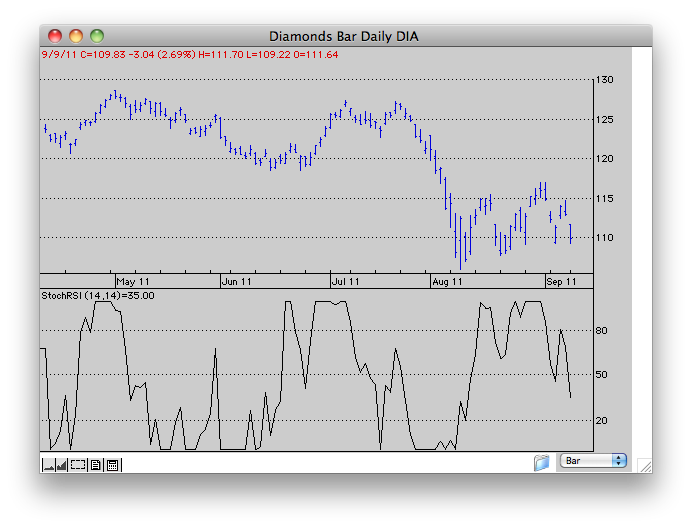
While each momentum study has a different presentation, there are three areas of interpretation that are shared: divergence; trend; and absolute value. Divergence occurs when the stock or commodity price is going the opposite direction of the momentum indicator. Trend refers to the trend within the indicator. In our example chart, you can see that the trend in StochRSI is down throughout most of July and halfway into August. In terms of absolute value, StochRSI is said to be at extreme values above 80 and below 20. Others look for the indicator to cross 50. The actual StochRSI values fluctuate between 0 and 1. We multiply the value by 100 to add uniformity with other momentum indicators. When using absolute value we would caution that, by design, StochRSI is more sensitive and moves to extremes much faster and more frequently than either stochastics or RSI.
All Content © 2017 Trendsetter Software, Inc.