Professional Analyst
Live, Streaming, Quotes
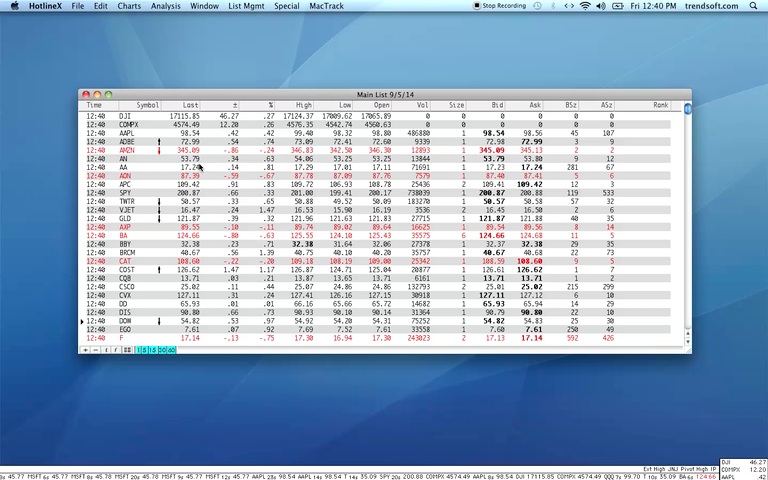
Our adjustable quote monitor displays...Time of sale, automatically adjusted to your time zone. Last sale, net change from the previous close, intraday high, low, open and volume. Size of last trade, bid, ask, bid size and ask size. All price data, stock, commodity, futures and options, can be displayed in fractions or decimal.
Quote monitor showing time and sale information (reduced 50%).
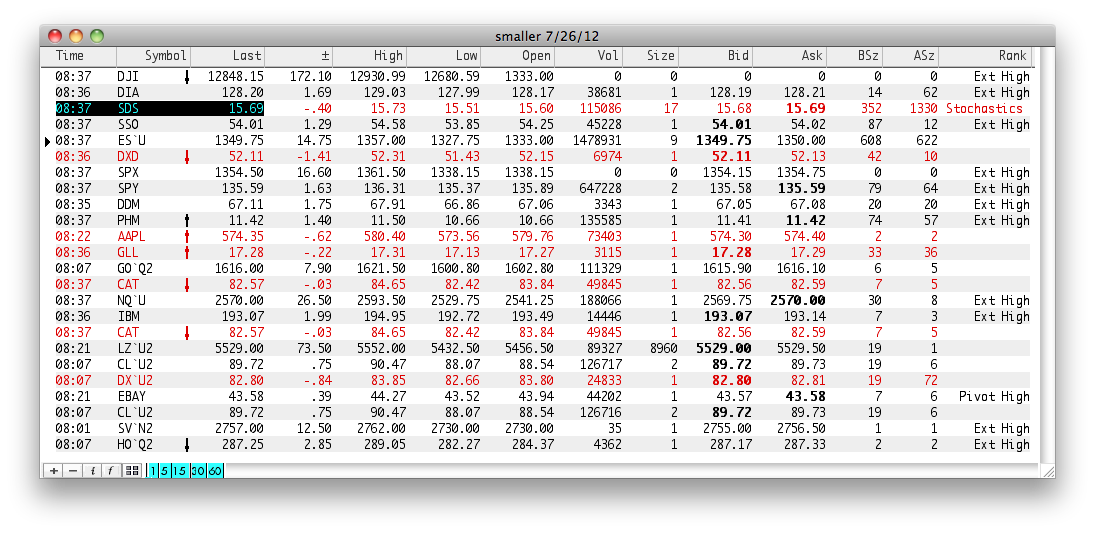
The delta on the left side of the monitor points to the last quote received. Securities that are trading down for the day are displayed in red while fields that match the last sale price are in bold. The directional arrow (right of symbol) indicates whether the last tick was up, down or sideways (no arrow).
![]()
Drag and drop rows and columns within the quote monitor to reflect your personal needs. The rank column (not shown) can be used to display your alert levels, EPS, P/E ratio, 12 month highs, lows or range, your entry price, percentage net change, dividends and more! There are over 25 ways to rapidly sort and rank your entire list of symbols.
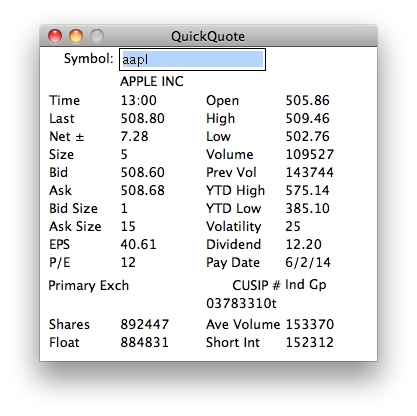
Our QuickQuote feature instantly displays detailed quotes on any symbol.
Featured Video
A brief video on the ins and outs of our quote monitor.
Applicable to both Pro Analyst and HotlineX.