Professional Analyst
|
Professional Analyst
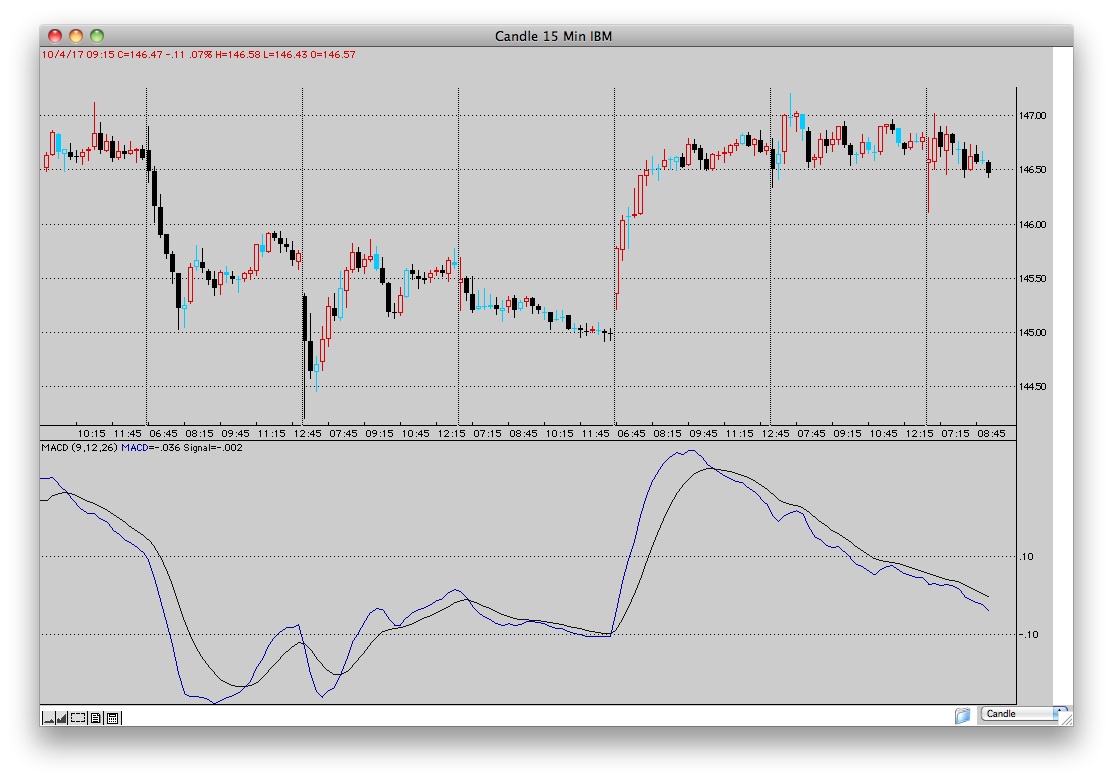
Real-time Charting and AnalysisBar, line, Japanese candle and Point & Figure charts are available in all time frames from one minute to monthly. And all charts, regardless of time frame, update every time a trade occurs. Pro Analyst offers the best technical studies from respected market experts such as George Lane, Welles Wilder, Gerald Appel, Joe Granville, John Bollinger including some of our own proprietary indicators. From Gann to Fibonacci, Larry Williams to Alexander Elder, Donald Lambert to Marc Chaiken, its all here, over 30 technical tools in all.
15 minute Japanese candle chart displaying 7 days of data with double line MACD.
Traders are awed by our Computer Generated Trendlines that can track and chart significant highs and lows in the blink of an eye. This same intelligence can be used to draw Fibonacci, Gann, Trident Linear Regression and Speed Lines. Personal preferences for study smoothing, formulation and display characteristics are stored independently for each type of chart, allowing this simple to operate, sophisticated research resource to be customized to your unique specifications.
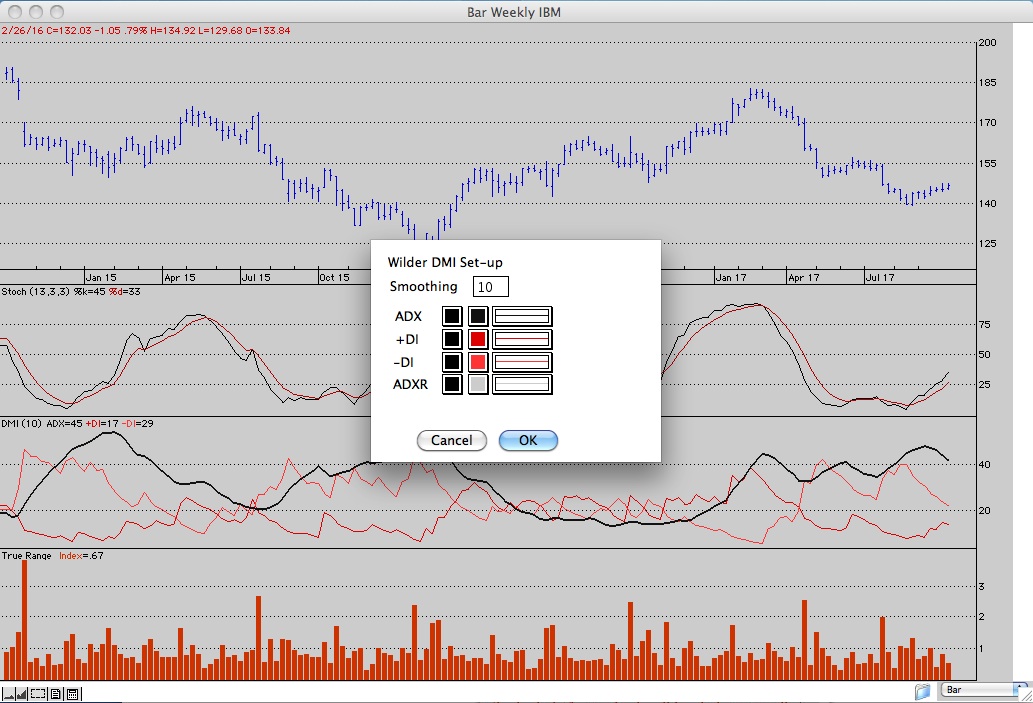
Control of smoothing colors, line thickness and patterns couldn't be easier.
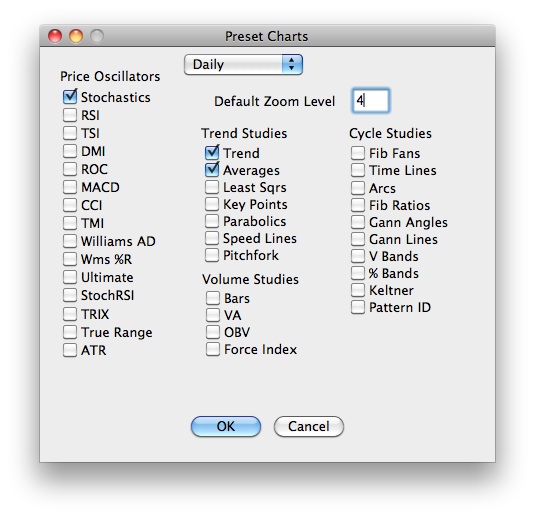
Default analytics can be easily specified for each chart type and timeframe and you can add or subtract indicators after the chart is drawn.
Featured Video
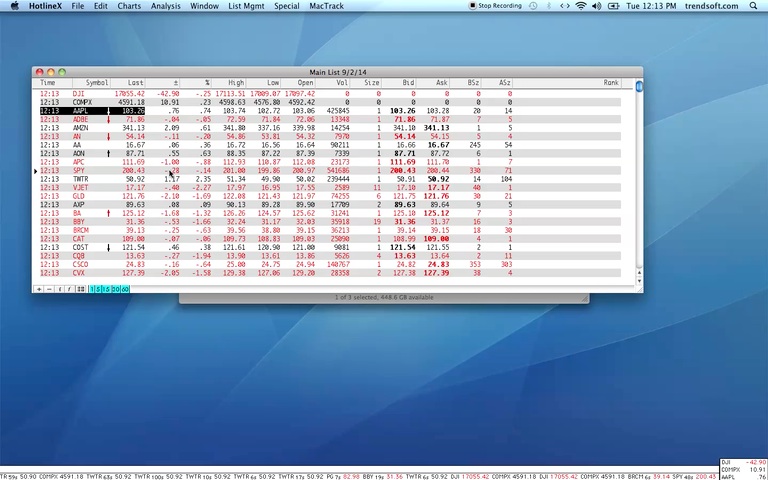
How to set up and use the unique chart suite demonstrated using HotlineX in real time.
Also demonstrates the speed and flexibility of our charting functions.
Applicable to both Pro Analyst and HotlineX.
© 2017 Trendsetter Software, Inc.