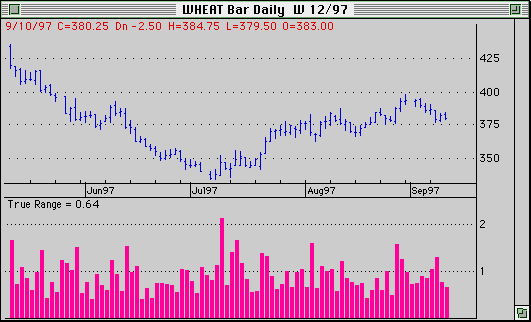
Our True Range Oscillator was inspired by the work of Jack Schwager, author of "Market Wizards" and "Technical Analysis on Futures". True range is also used in DMI and William's AD calculations, among others. It is defined as the true high - the true low, where the true high is the maximum of today's high and the previous close and the true low is the minimum of today's low and the previous day's close.
The oscillator plots the volatility ratio (VR) which is defined as today's true range divided by the true range of the past 10 periods. Wide ranging days signal an impending change in trend. A wide ranging day is defined as a day when the VR exceeds 2. Note that this occurs exactly once in our selected chart of Wheat Futures.

Note the buy signal in early July
Chart created using Personal Analyst from Trendsetter Software.
Technical Analysis Table of Contents
Back to Trendsetter Software Products and Services
©2000 Trendsetter Software