All of Trendsetter's software products can create moving averages with exceptional flexibility. What does that mean? As you read the following description of the different types of moving averages and the strategies for their use, know that our software can do them all.
One of the axioms of wall street is "the trend is your friend" but how do you identify the trend when prices are so volatile? It is not uncommon for the prices of stocks, futures and commodities to go up up one day and down the next. Traders, investors and analysts have many tools in their toolbox to help them identify price trends. Moving averages are one of them.
So what is a moving average? To find the average price over 10 periods we add up the 10 prices then divide by 10. To turn this simple calculation in to a moving average, we recalculate the average each period and plot the current result. So on day 10 we add up the first 10 days, divide by ten and plot the result. On day 11, we add up the past 10 days (i.e., all the days except the first) divide the result and plot the result. As time goes on, we are always adding up the last 10 days, dividing by 10 and plotting the result. The various points are traditionally connected together by a single line. That line is referred to as a 10 day simple moving average.
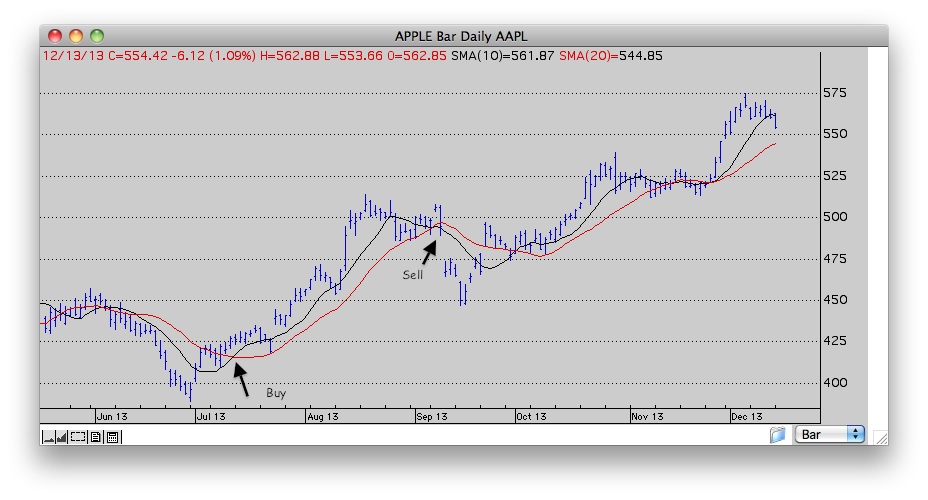
One of the variations on this tool is to change the length of the average. The more periods used to calculate the average the smoother the resulting line which is why the number of periods is often referred to as "smoothing". One of the more common interpretations is to plot two or more moving averages of different smoothing values and look for when the averages cross. Since shorter moving averages react to recent price changes more rapidly, when they cross above the longer term moving average is considered a buy signal and when they cross below it is time to sell.
10 and 20 day simple moving averages demonstrating crossover buy/sell system
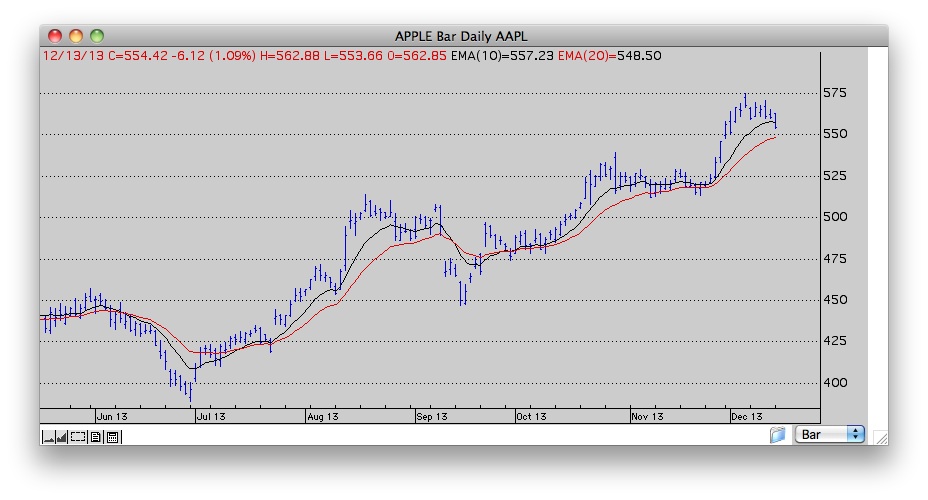
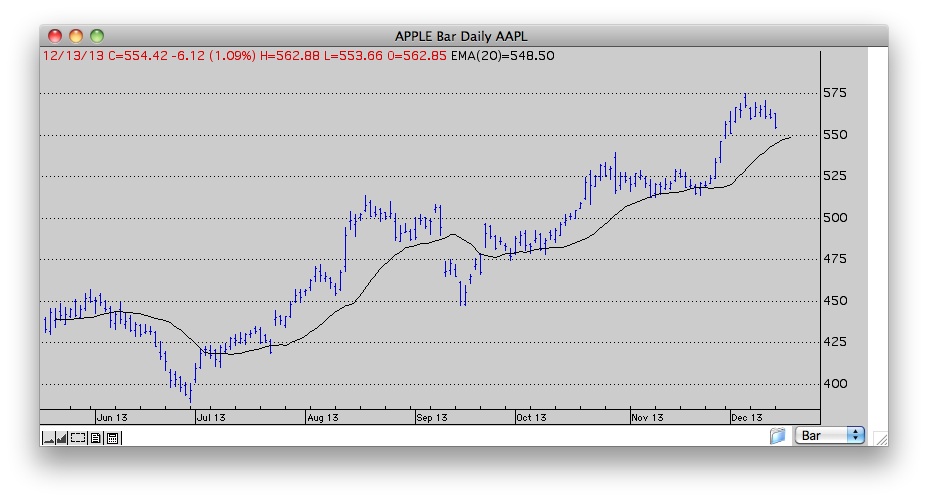
Before the age of computers and electronic calculators, simple moving averages were not considered simple at all. Think about a 200 day moving average. Each new day, you have to add up the last 200 prices and divide by 200. Talk about tedious! Hence the exponential moving average (EMA) was born. The formula for the EMA looks like this... Current EMA= ((Price(current) - previous EMA)) X multiplier) + previous EMA. The multiplier is derived by dividing the constant 2 by the smoothing + 1. So a 200-day EMA has a multiplier of 2/( 200+1) = .00995. So each day, instead of adding up the last 200 days of data we subtract yesterday's average from today's price, multiply the result by the multiplier then add yesterday's price to the result. By example, assume yesterday's EMA was 494.71 and today's price is 554.42. Applying the formula, step 1: 554.42 - 494.71 = 59.71. Multiply the result b .00995 = 5.94. Add the result to yesterday's EMA and the new EMA is 500.65. That is a lot faster than adding up 200 numbers! With today's computers, speed is no longer of consequence so why do many still prefer exponential averages? One reason is they apply more weight to recent data. Beyond that is a matter of personal choice and how you are using the averages in your analysis.
10 and 20 day exponential moving averages
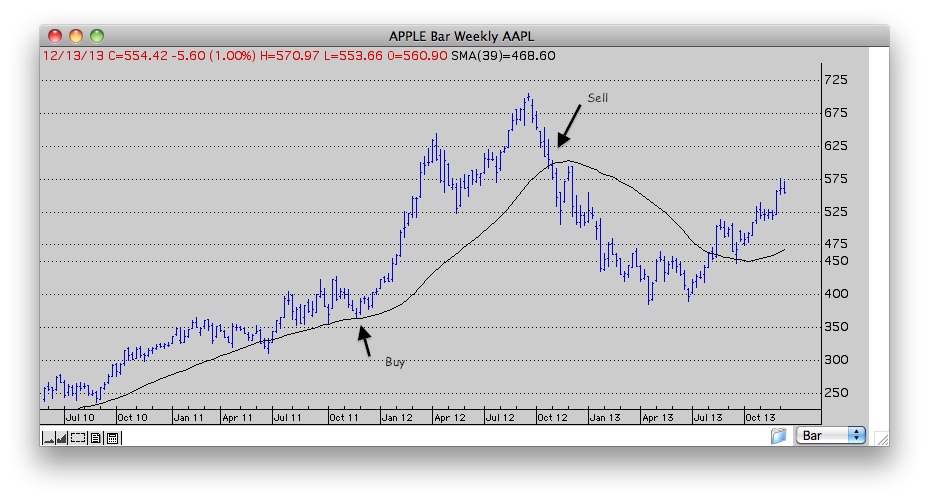
A common buy and hold strategy is to buy when the price is above the 200 day moving average and sell when the price moves below the average. This doesn't occur very often so we demonstrate using a weekly chart and a 39 week moving average. Since there are market holidays, 39 weeks is considered the same as 200 days.
Buy and Hold strategy using 39 week average
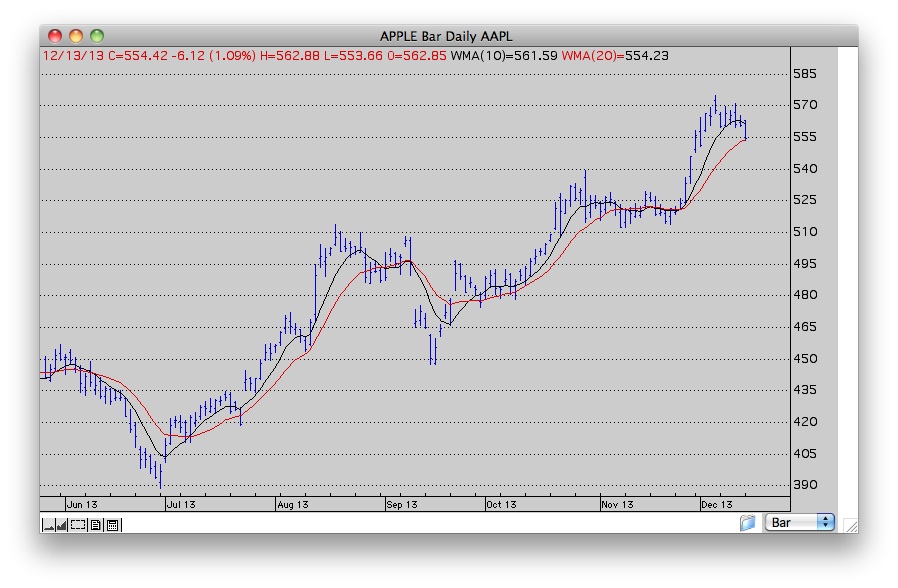
Weighted moving averages are another type of average designed to place more emphasis on recent data. This average is calculated by taking each of the prices over a given time period and multiplying them by its position in the data series. The results are then added up and divided by the sum of the multipliers. As an example, a 10 day moving average multiplies the most recent day by 10, the day before by 9, the day before that by 8, etc. The results are summed and divided by the sum of the multipliers. Fortunately we have computers to do the calculations and draw them on our charts.
Weighted moving averages
This next graph shows a 20 day moving average calculated by all three methods. The black line is the simple MA, the red line is the Exponential and the green line is the weighted MA. Their current values are in the legend at the top of the screen. The graph is followed by the last 20 periods of the three moving averages so you can how they differ.
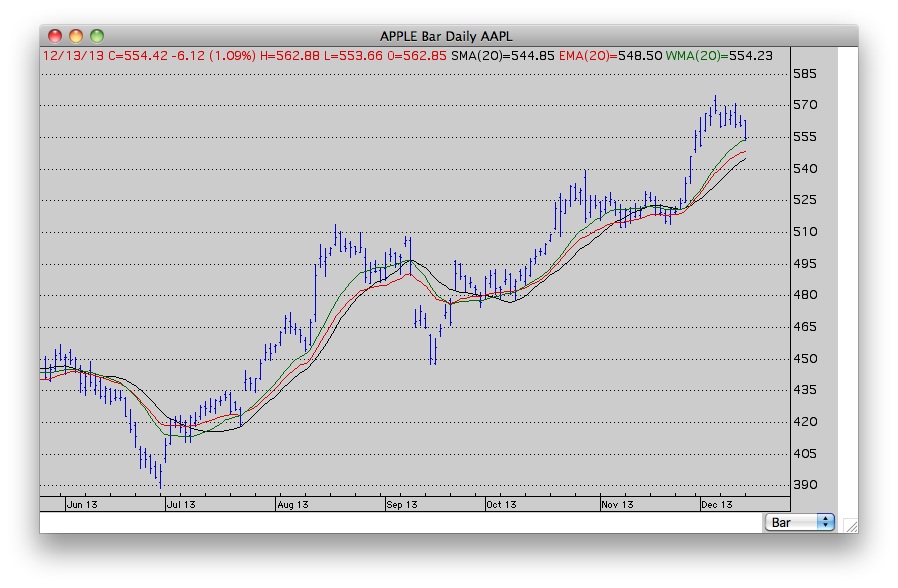
Date		   Price	  Simple     Exponential       Weighted
11/15/13	   524.99	  522.86	518.30		522.37
11/18/13	   518.62	  522.72	518.33		521.97
11/19/13	   519.54	  522.70	518.44		521.66
11/20/13	   515.00	  522.21	518.12		520.93
11/21/13	   521.13	  521.67	518.40		520.83
11/22/13	   519.79	  521.36	518.53		520.65
11/25/13	   523.74	  521.05	519.03		520.87
11/26/13	   533.40	  521.89	520.40		522.05
11/27/13	   545.96	  522.94	522.83		524.34
11/29/13	   556.07	  524.61	526.00		527.50
12/02/13	   551.23	  526.17	528.40		530.03
12/03/13	   566.32	  528.15	532.01		533.86
12/04/13	   565.00	  530.13	535.15		537.37
12/05/13	   567.90	  532.47	538.27		540.96
12/06/13	   560.02	  534.85	540.34		543.59
12/09/13	   566.42	  537.14	542.82		546.59
12/10/13	   565.54	  539.47	544.99		549.30
12/11/13	   561.36	  541.54	546.55		551.38
12/12/13	   560.54	  543.53	547.88		553.19
12/13/13	   554.42	  544.85	548.50		554.23
Displacing or offsetting moving averages is another strategy. This involves shifting the average to the left or the right of the prices. Some traders offset the MA to the right as a way of projecting price. In this example we've shifted a 20 day exponential average to the right by 3 days.
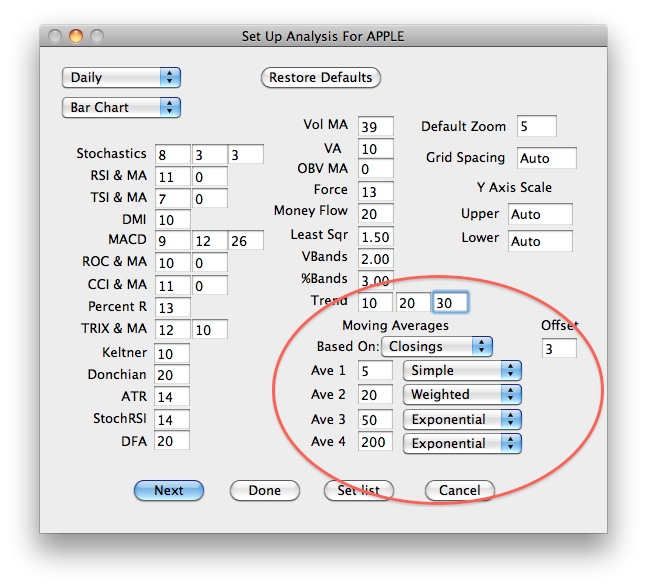
More choices... we used the word price earlier because moving averages can be calculated using a variety of data. Personal Hotline which created the examples for this page, can create moving averages based on closing price, opening prices, pivot points, volume, RSI, TSI, ROC, TRIX and OBV and many of the technical tools we employ are based on moving average data. We can even create a chart with 4 moving averages where one if based on the high, another the low, a third the close and the fourth moving average is based on the open.
This is how easy it is to set up your moving average preferences in Personal Hotline. In this example we've chosen four moving averages: a 5 day simple, a 20 day weighted, a 50 day exponential and a 200 day exponential and if we choose to offset, we will offset by 3 days. You can have different set ups for different charts, different symbols and different time frames.